Frequency stability test of reference signal oscillator
Introduction
Most wireless transmitters and receivers have an oscillation circuit inside. However, external oscillator circuit that is more stable and accurate may be connected. A frequency of 10 MHz is widely used as such the reference. Some software defined radios (SDRs) can also use an external oscillator circuit.
I tried to measure the frequency stability of such an oscillator.
Frequency stability measurement
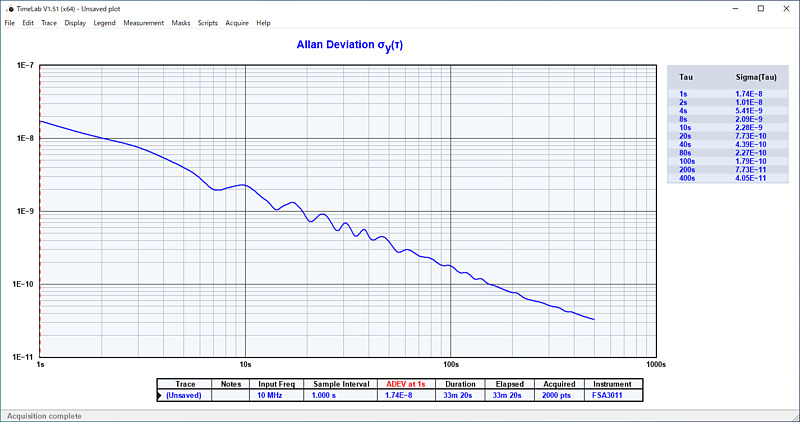
As the observation time increases, frequency stability increases due to the noise averaging effect. As the observation time becomes longer, on the other hand, the effect of frequency displacement becomes more dorminant and the frequency stability decreases. The averaged time is plotted on the horizontal axis and the deviation is plotted on the vertical axis, and the plot is so called Allan deviation. The smaller the Allan deviation, the more stable the oscillator is.
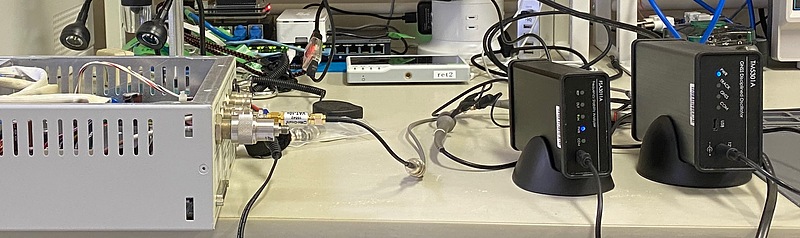
The frequency stability analyzer used here is a Turn Dynamic Systems FSA3011. I purchased this FSA3011 on AliExpress, but the device specifications and company details are unknown. However, the Internet site LeapSecond.com, which I personally refer to for frequency stability measurements, has helpful materials for this FSA3011.
With this FSA3011, we need our own reference oscillator. Here, I used two oscillators I have. Here, a Hewlett Packard Z3805A was used as the reference (REF) oscillator, and a TM5301 was used as the device under test (DUT) oscillator.
The voltage range of both the FSA3011’s REF input and DUT input is from 0.8 Vpp (peak-to-peak) to 3.3 Vpp, so care must be taken to avoid input level overrange.
The Z3805A’s 10 MHz reference signal is output via a BNC connector. The output level observed on the oscilloscope was 6.16 Vpp. Therefore, I connected a 10 dB pad (coaxial attenuator) to this output to match it to the REF terminal input of FSA3011. On the other hand, for the TM5301’s 10 MHz reference signal output, the output was 4.88 Vpp, and I used a 3 dB pad to match the FSA3011’s DUT terminal input.
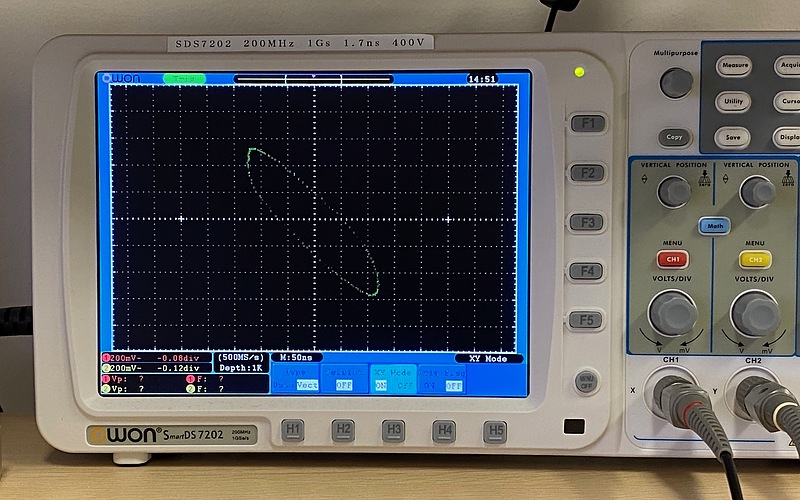
If both of them output sine waves of the same frequency, we should see a circle or a straight line on the screen when we connect them to the oscilloscope’s X and Y axes, respectively. This kind of shape is called Lissajous. Here, the Lissajous was distorted because the Z3805A’s output was not a clean sine wave.
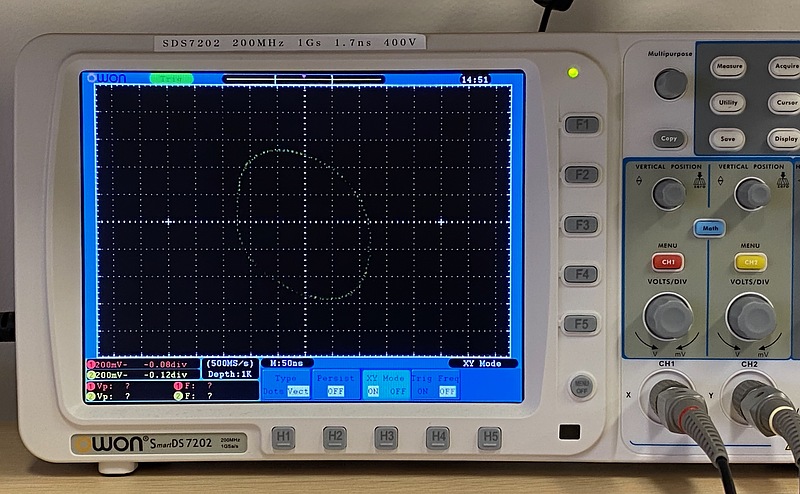
Both of these two reference oscillators have the ability to stabilize the frequency based on GPS radiowaves. Due to poor radio reception in my laboratory, I gave up using this GPS synchronization function. Since this Lissajous turned from a circle to a straight line in about 2 seconds, there is a frequency difference of about 0.5 hertz between the two.
Alan deviation
When this FSA3011 is connected to a Windows PC, it is recognized by the PC as a 115,200 bps serial port. By starting the dedicated software and setting parameters such as the serial port bit rate and observation time, the Allan deviation from past data will be displayed in real time. This FSA3011 measures one sample per second. The example observation is 20,000 points (just under 6 hours), but here I chose 2,000 points for this observation.
I plan to connect a GPS antenna to these reference oscillators to ensure its original performance, and then measure the frequency stability of the receiver I have.