Observation of optical spectrum using microspectrometer C12880MA and Analog Discovery 2
Introduction
Humans judge the color from the red/blue/green light intensity ratio, while other animals judge the color from the intensity ratio of different light wavelengths. Since the light spectrum is continuous, the colors seen by the human or animal eye do not always represent the correct light spectrum of the object.
On the other hand, the leaves of the plant are green, because they reflect the green light without absorbing it, so they do not grow even when given the green light. Spectroscopy may be useful for agricultural IoT.
So, this time, I made a spectroscope and observed various lights.
Hamamatsu Photonics Micro Spectrometer C12880MA
The digital microspectrometer used this time detects the optical spectrum using a CMOS linear image sensor and a convex blazed grating. The wavelength range of light that can be measured with this spectrometer is 340 nm to 850 nm, and it can observe from a part of infrared rays to a part of ultraviolet rays. This spectrometer is sold by Akizuki Denshi, and the specification is [available](http://akizukidenshi.com/download /ds/hamamatsu/c12880ma.pdf). The product also came with its calibration table.
In order to use this spectrometer as easily as possible, I used Digilent’s Analog Discovery 2. This is because this one can perform analog signal observation, clock pulse generation, and power supply necessary for using this spectrometer. The power and control voltage is 5 V and the video output is an analog value in the range of 0 V to 5 V.
Equipment setup
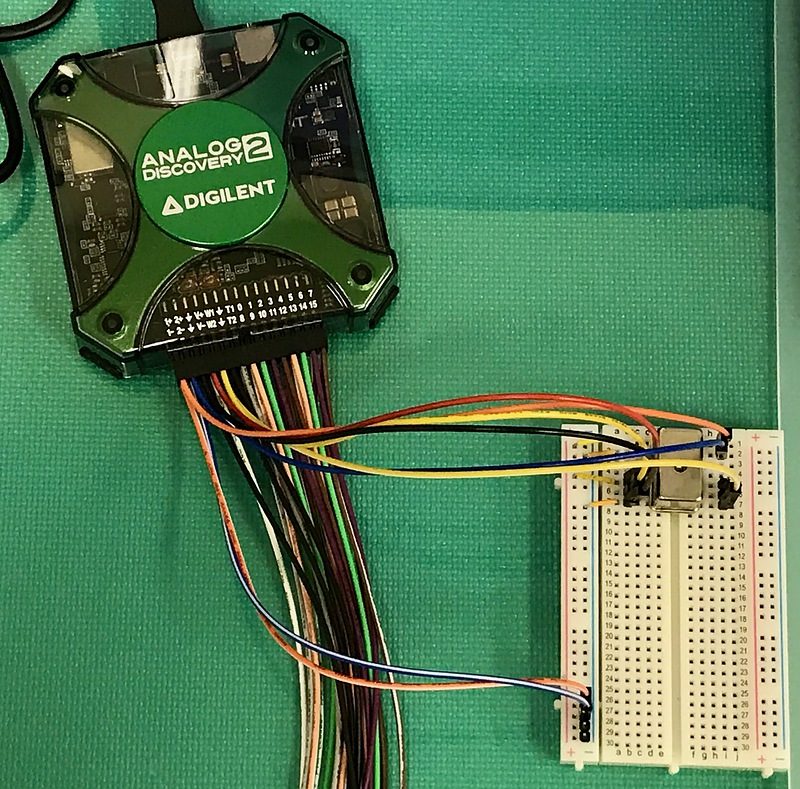
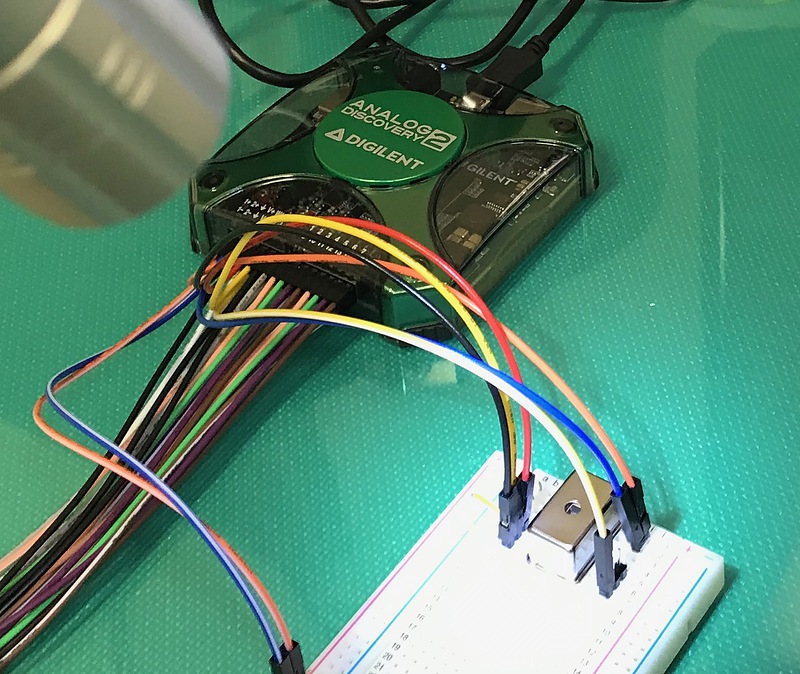
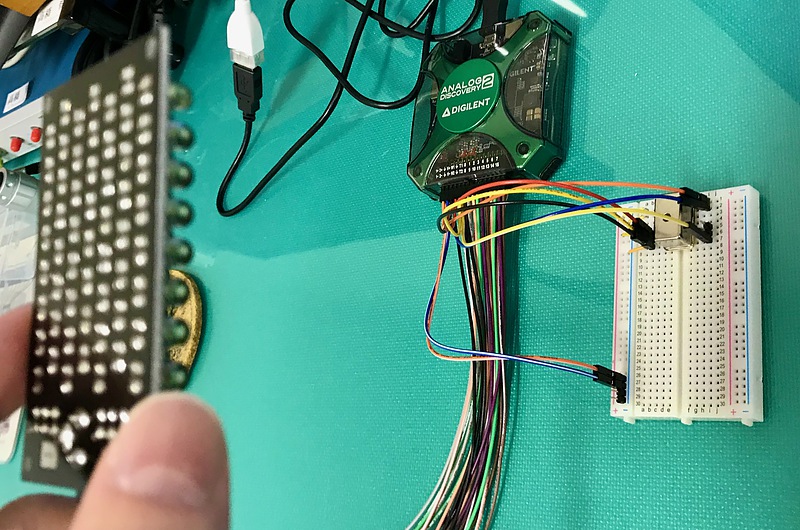
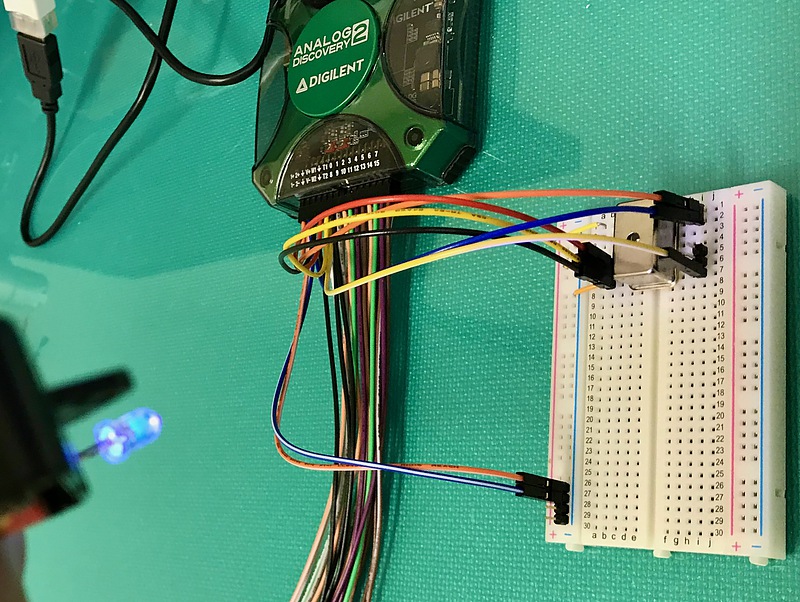
All we have to prepare for the experiment is a microspectrometer C12880MA, Analog Discovery 2, breadboard, pin header, jumper pins, and a PC. Download and install the software required for Analog Discovery 2 in advance. Here, connect Analog Discovery 2 and C12880MA as follows.
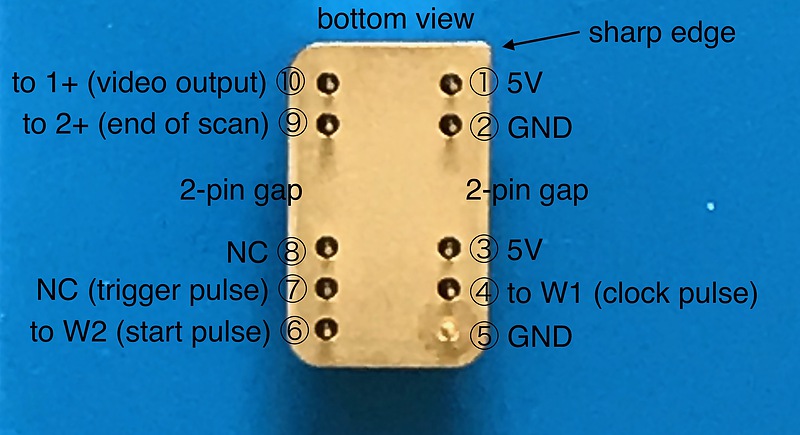
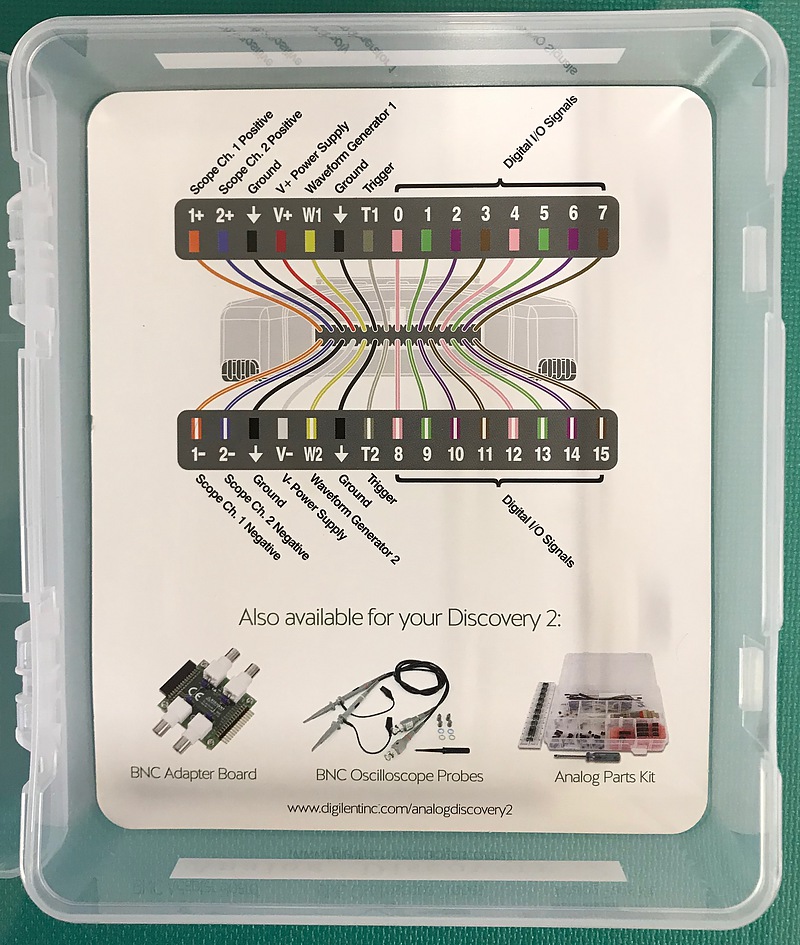
Here, W1 and W2 represent the arbitrary waveform generation output of Analog Discovery 2. 1+ and 2+ represent Analog Discovery 2 oscilloscope inputs, NC represents non-connection, and GND represents ground. Connect the negative pins 1- and 2- of the oscilloscope input of Analog Discovery 2 to GND. Analog Discovery 2 has an easy-to-understand wiring diagram and color-coded lines.
| C12880MA | Analog Discovery 2 | function |
|---|---|---|
| pin 1 | red (V+) | 5 V |
| pin 2 | black (GND) | GND |
| pin 3 | red (V+) | 5 V |
| pin 4 | yellow (W1) | clock pulse |
| pin 5 | black (GND) | GND |
| pin 6 | yellow/white (W2) | start pulse |
| pin 7 | trigger pulse output | |
| pin 8 | NC (non connection) | |
| pin 9 | purple (2+) | end of scan output |
| pin 10 | orange (1+) | video output |
| pin 2, 5 | orange/white (1-) and purple/white(2-) | oscilloscope ground |
Next, I configured Analog Discovery 2. The C12880MA accumulates light at the rise of the start pulse and starts data output at the fall of the start pulse. However, valid data is output after the 89th clock pulse. Therefore, video output data for 88 clock pulses must be skipped from the fall of the start pulse for observing the results correctly. The number of valid data is 288. Because it is difficult to set up Analog Discovery 2 based on this specification, I decided to trigger on the falling edge of the end of scan pulse output and display the optical spectrum by delayed sweep.
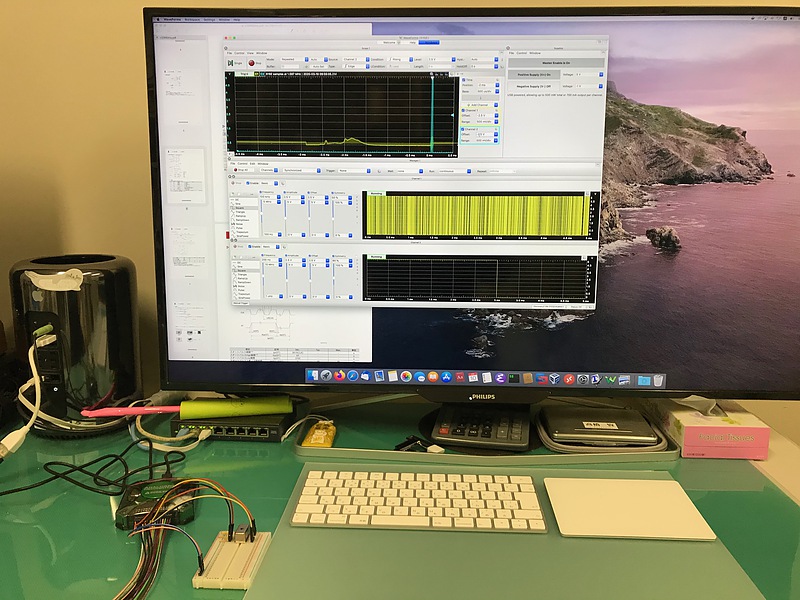
On the Welcome screen of the Analog Discovery 2 software, add Scope, Supplies, and Wavegen functions and set each function.
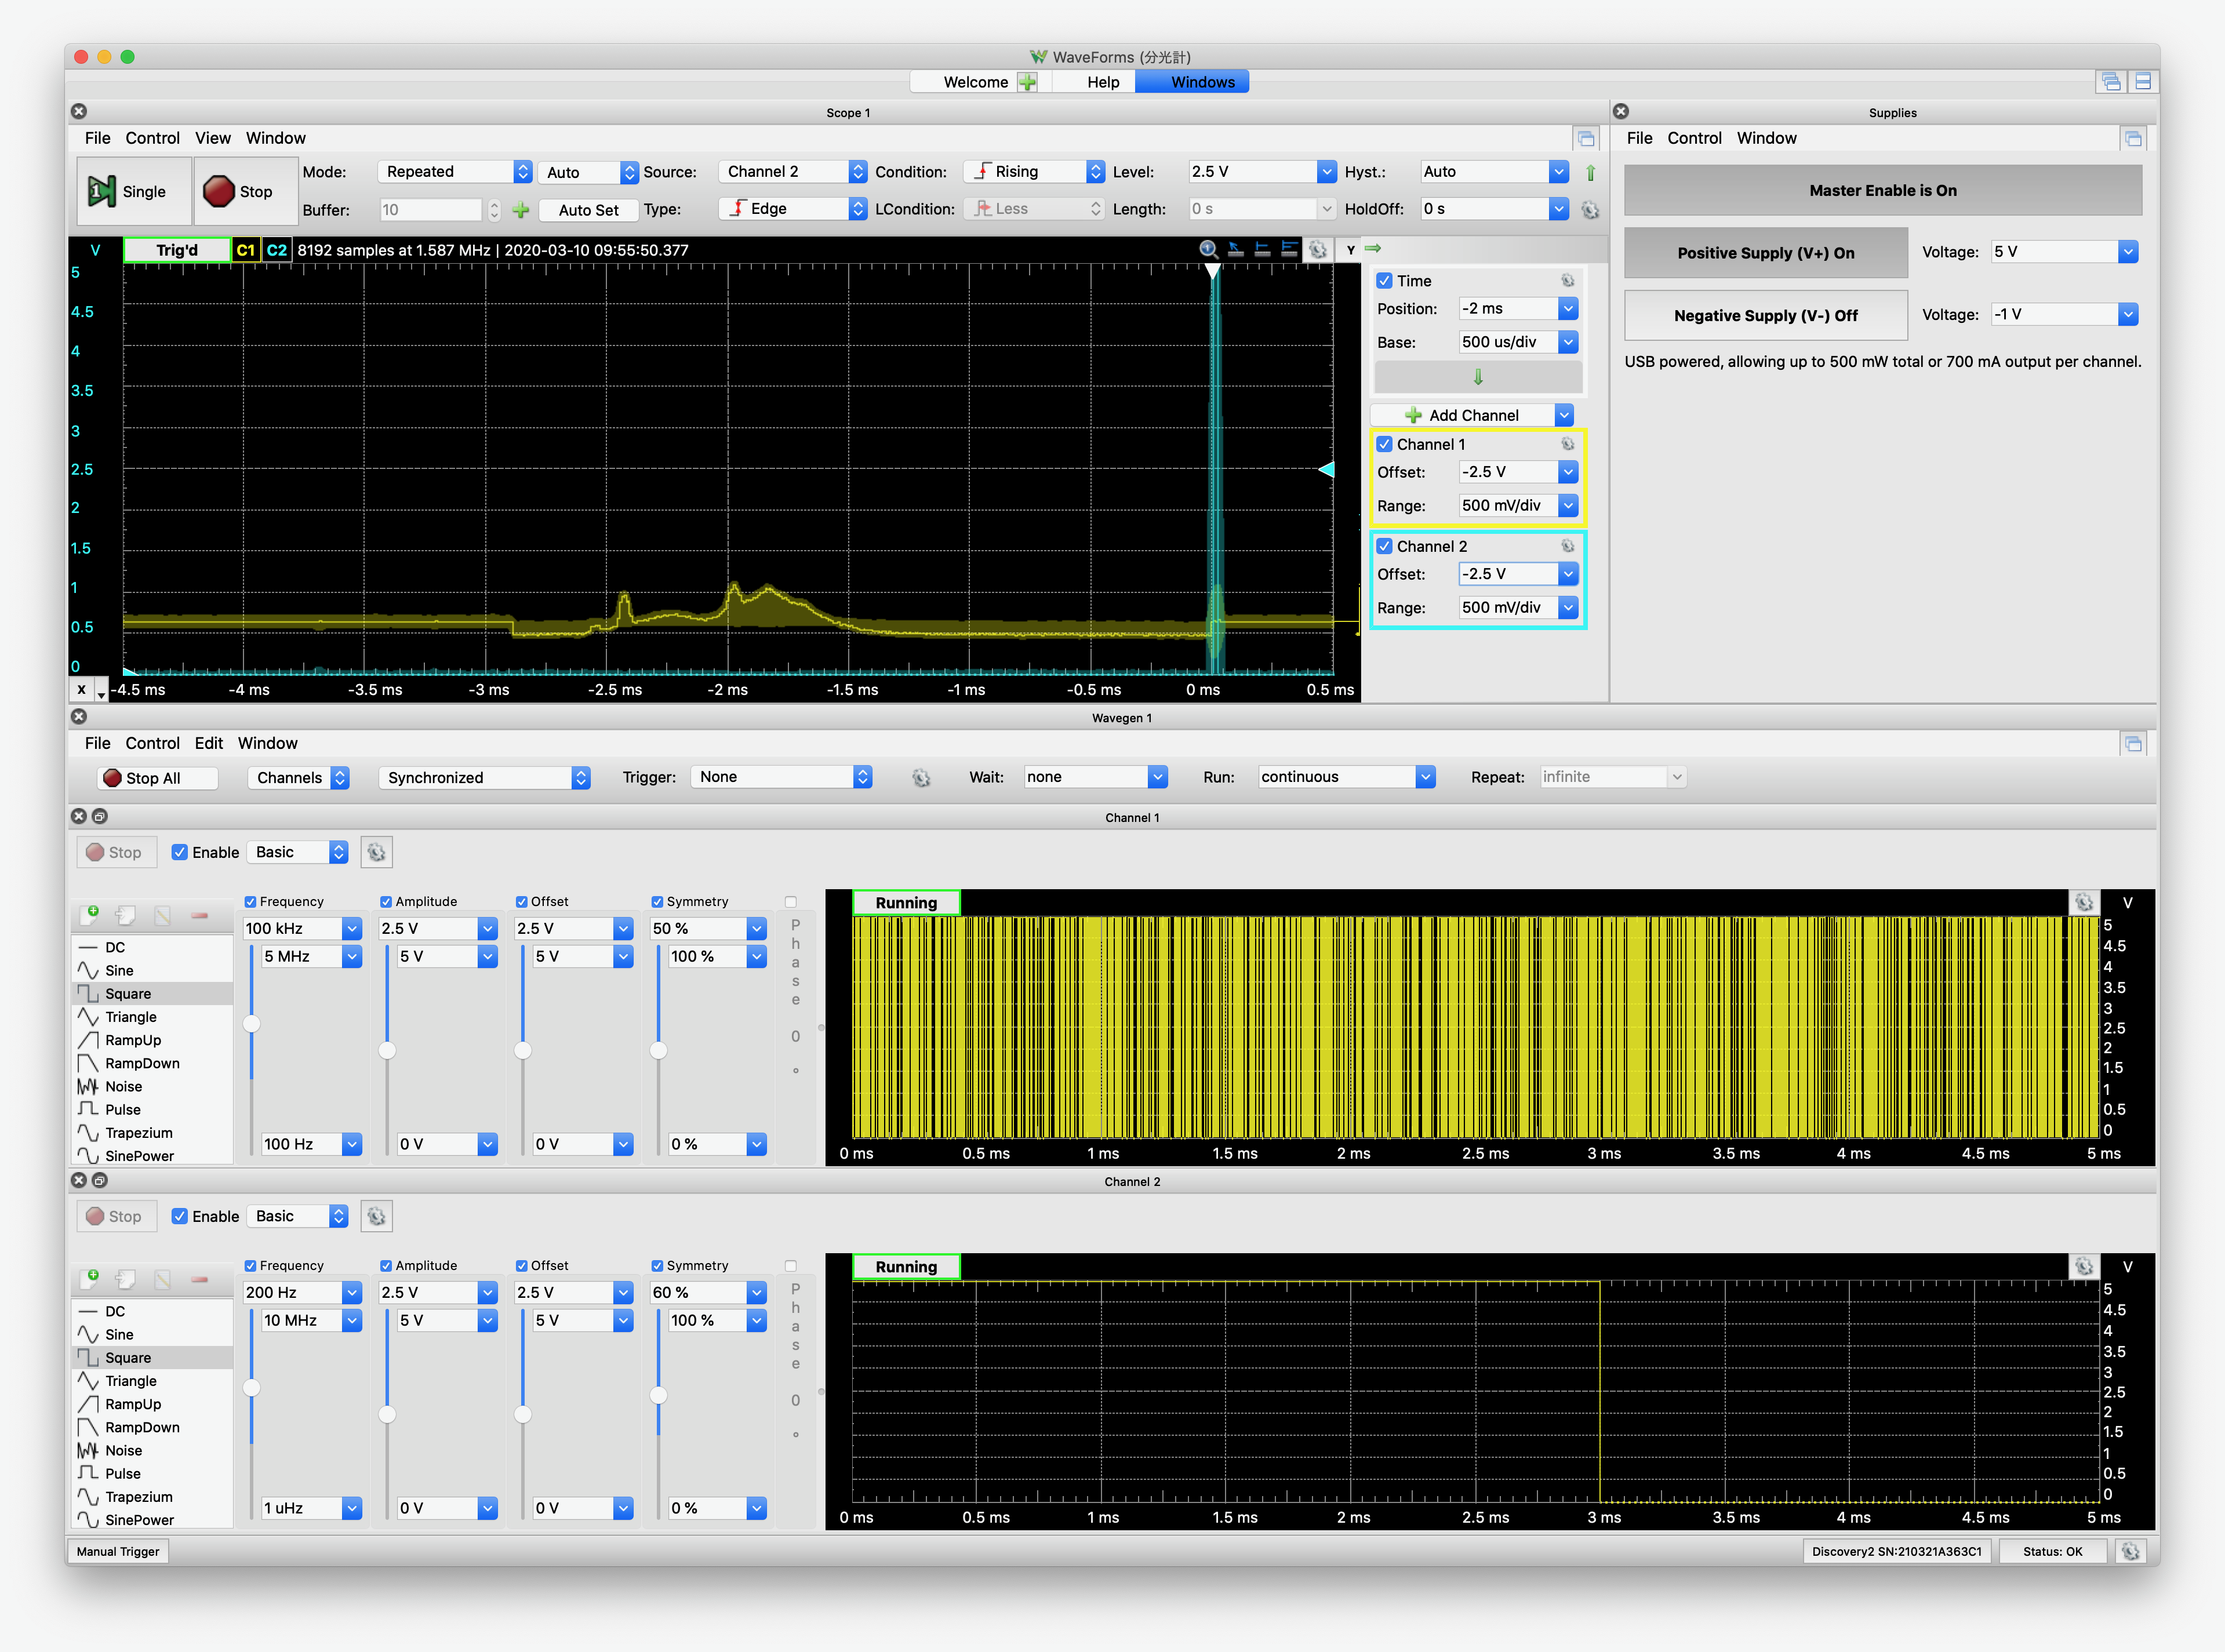
The scope was set to trigger on the rising edge of the end of scan output, and its threshold was set to half the power supply voltage (2.5 V). Supplies V + is set to 5 V. Even when Master Enable was off, V + output was about 1.55 V, but it did not break down C12880MA.
In Wavegen, the clock pulse (W1) was set to a square wave, a frequency of 100 kHz, and a duty ratio of 50%. The start pulse (W2) was set to 200 Hz for a square wave, and the duty ratio was set to 60%. Increasing the latter duty ratio increases the accumulation time and it results in increase in the sensitivity. Also, lowering the clock frequency increases sensitivity. The maximum value of the clock pulse frequency is 5 MHz. The start pulse frequency must be less than 1/381 of the clock pulse frequency.
These configuration files are placed in here. If you need it, please download and use it.
Observation of optical spectrum
Ambient light
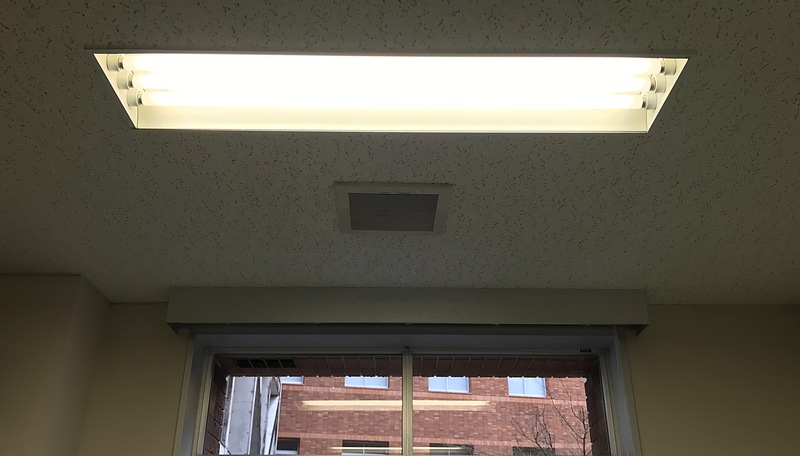
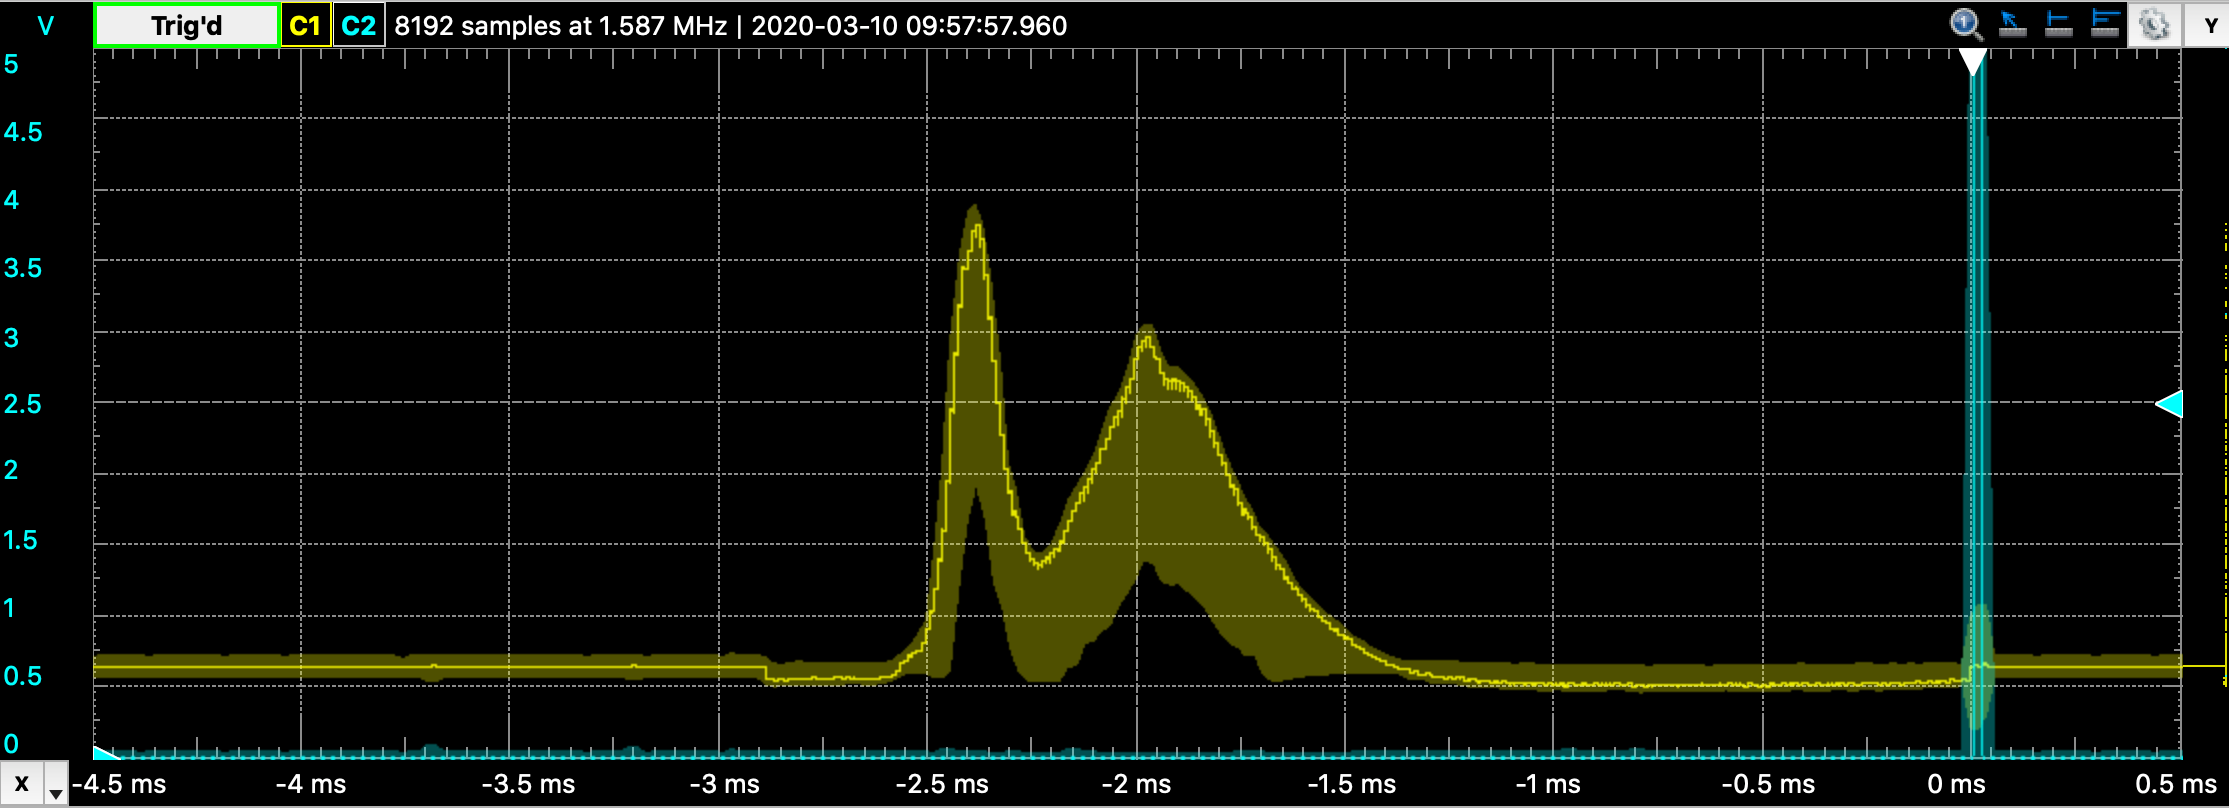
First, the ambient light spectrum of the laboratory was measured. The light sources are fluorescent light and natural light.
The result is as follows: From the right side of -3 ms on the horizontal axis to 0 ms is the effective data of the optical spectrum. The left side is short wavelength (purple) and the right side is long wavelength (red).
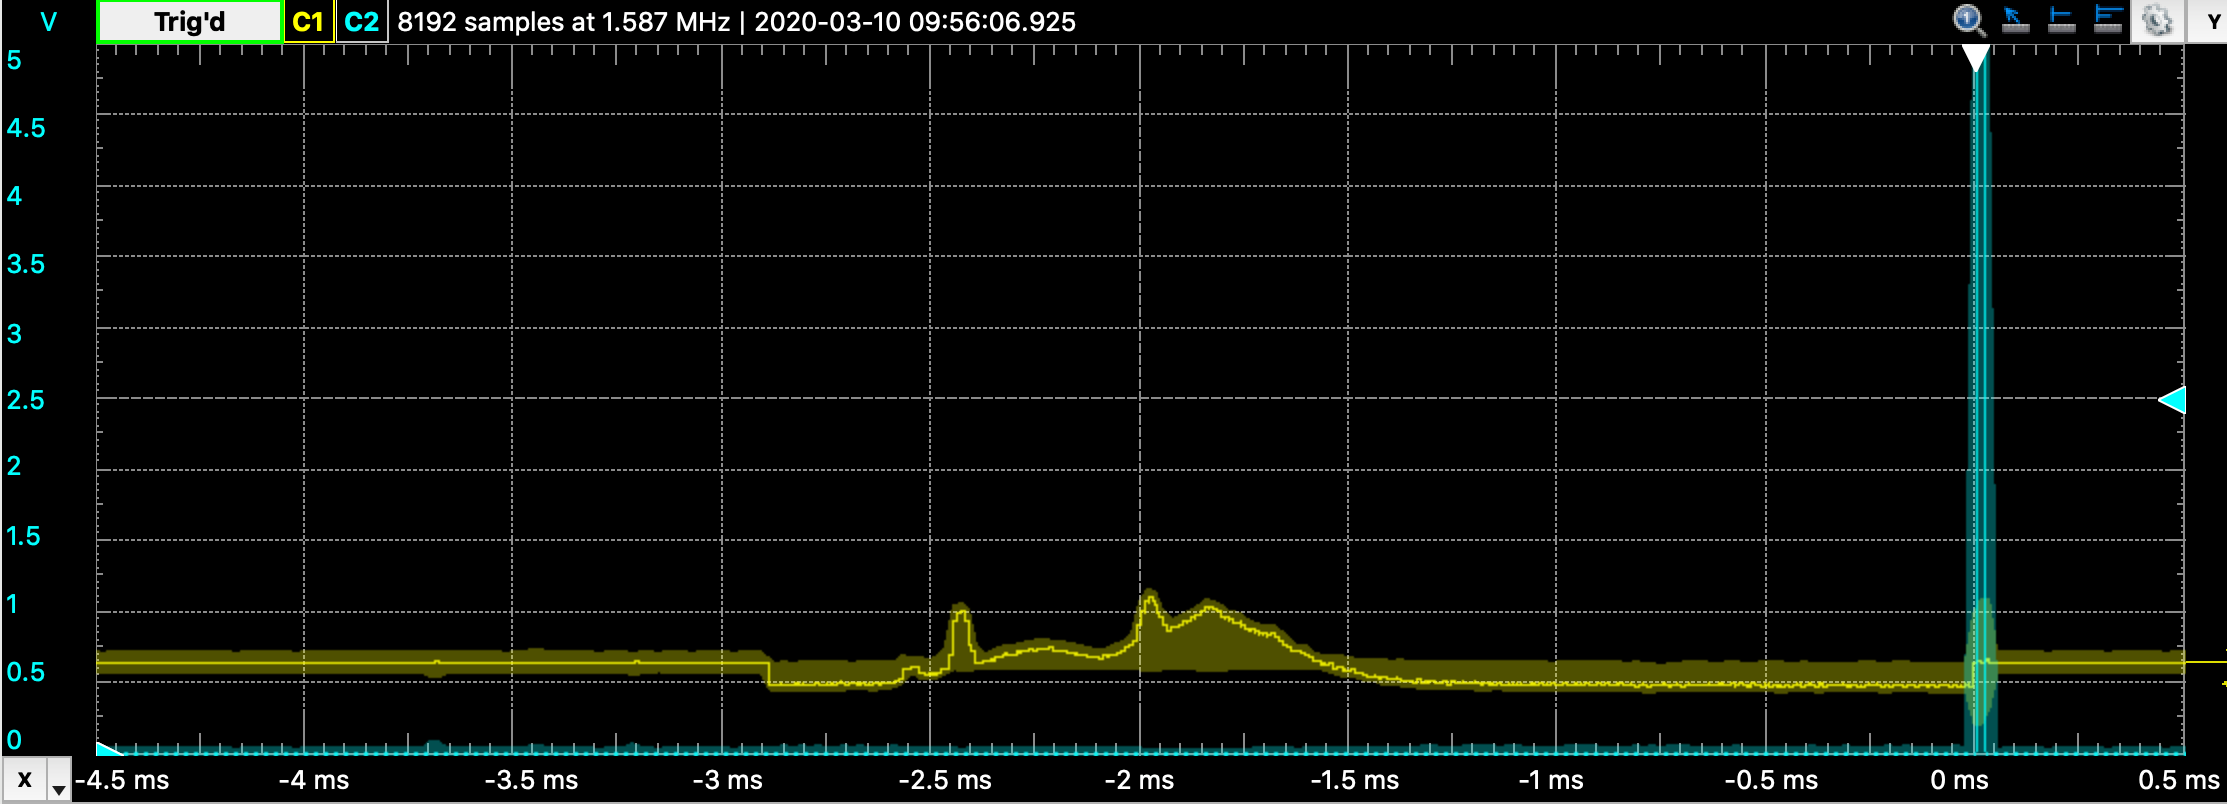
In this observation, a continuous spectrum with multiple peaks was observed. The video output had about 0.5 V of background noise. The specific wavelength must be determined from the calibration table by counting the number of pulses.
LED light
The spectrum of the LED light purchased at a one-dollar shop was measured. When this light was applied directly to the spectrometer, the video output was saturated, so the optical axis was shifted.
Compared to the fluorescent light, the light of this LED light looks similar, but the peak wavelength is different. Also, two peak wavelengths were observed.
Infrared projector
The LED of the infrared projector used here was OptoSupply’s OSI5LA5453B, which has a peak wavelength of 940 nm and an emission intensity per unit of about 30 mW/Sr. This projector combines 56 LEDs. This light was not visible. The beam width is not written in the specification of this LED, but the light is out of the measurement range of this spectrometer.
The measurement results showed a large spectrum in the long wavelength region as shown below.
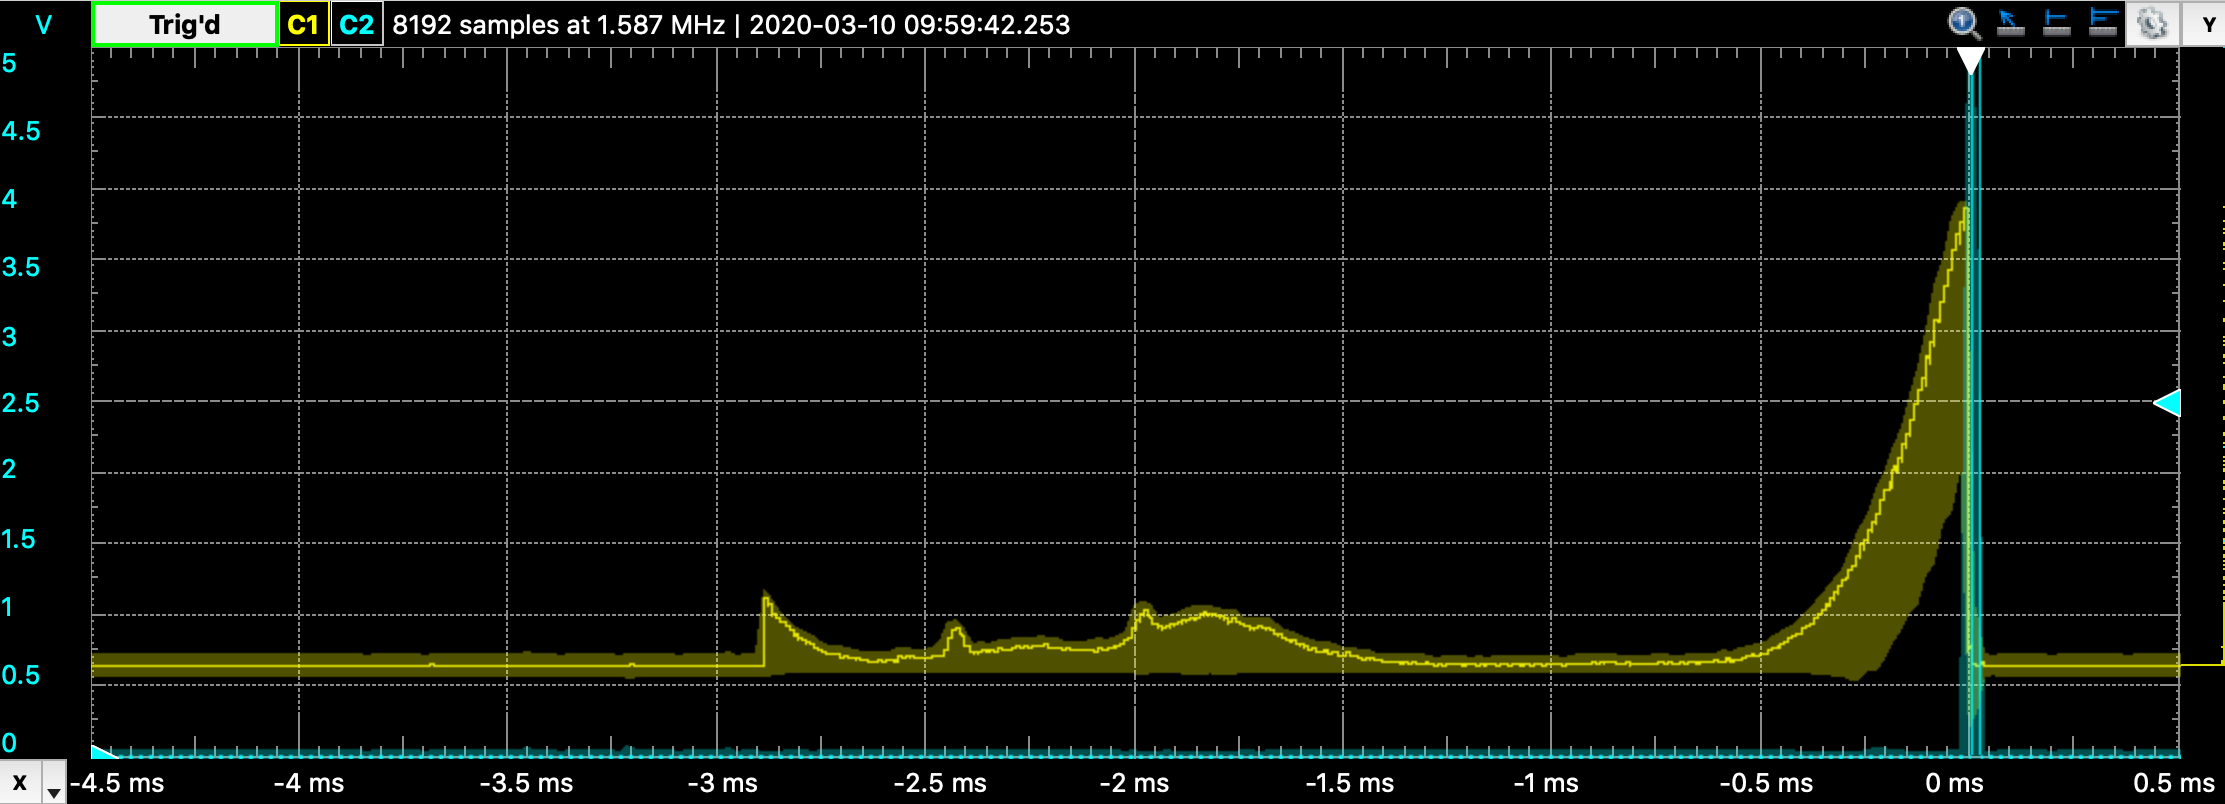
It is probable that light that could be measured by this spectrometer was observed due to the spread of the LED spectrum. The output was saturated as the emitter LED was close to the spectrometer because the output power was high.
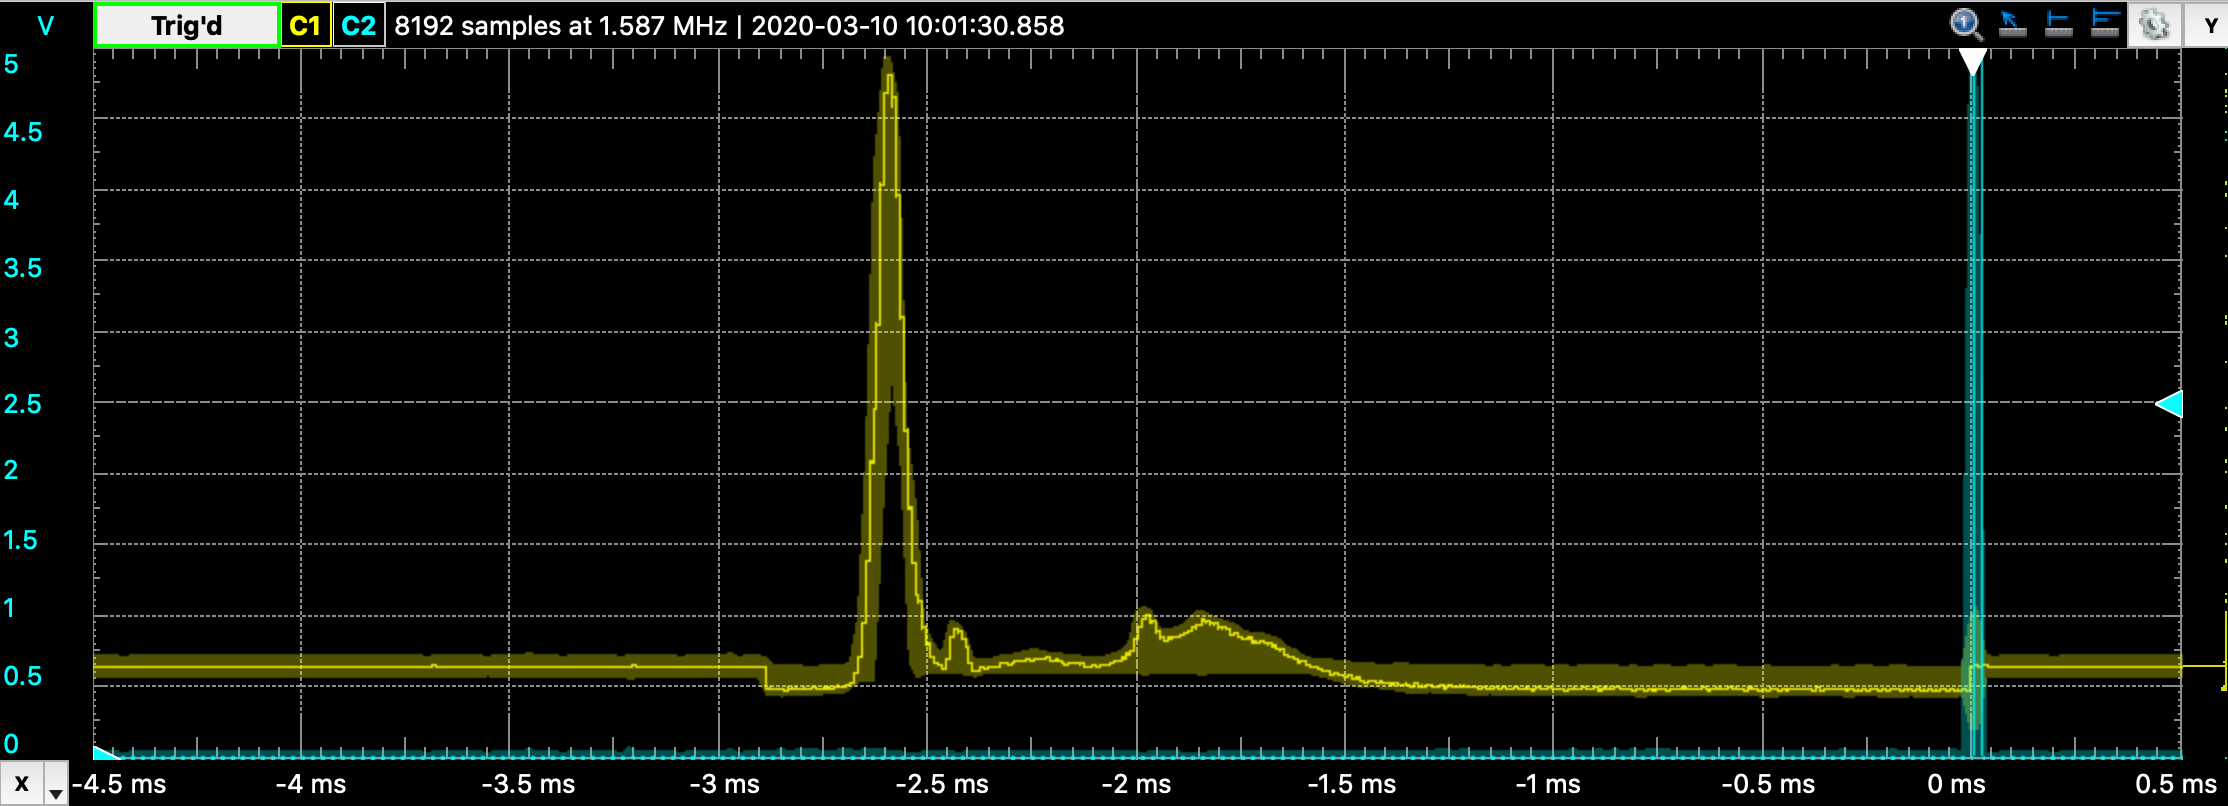
UV LED
Next, UV LEDs were measured. This LED is in Gakken’s Study Kit for elementary school students, and its specification is unknown. Ultraviolet light should not be visible, but when this LED is energized, blue visible light is observed. The shortest wavelength of the LED emission color is determined by the forbidden bandwidth of the base material, but its spectrum spreads to longer wavelengths and it would be visible.
Measurements showed that it was a strong single-spectrum light.
Conclusion
It was fun to observe the invisible light. I want to make a spectrometer on M5Stack so that we can carry one easily. Hamamatsu Photonics’ catalog of microspectrometers also includes spectrometers that observe other wavelength ranges and high-sensitivity spectrometers. I want to try thermography and CO2 sensor as well as these spectrometer.